Cylindric body element with metabolism and blood perfusion
System
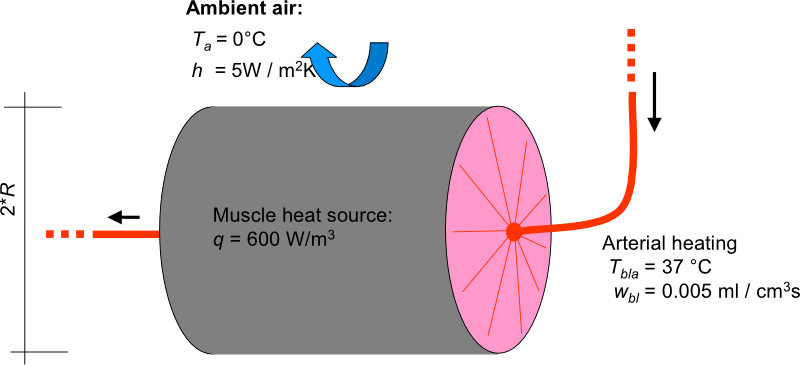
System and boundary conditions
| Quantity | Value | Units | Description |
|---|---|---|---|
| T init | 0 | °C | |
| w bl | 0.005 | ml / cm 3 *s | Basal values for blood perfusion |
| q m | 600 | W / m 3 | Basal values for metabolic rate |
| k | 0.42 | W / m*K | Conductivity |
| ρ | 1085 | kg / m 3 | Density |
| c | 3768 | J / kg*K | Heat capacitance |
| T bla | 37 | °C | Fixed aterial blood temperature |
| R | 5.48 | cm | Radius |
| BE | 1 | Number of body elements |
Problem description
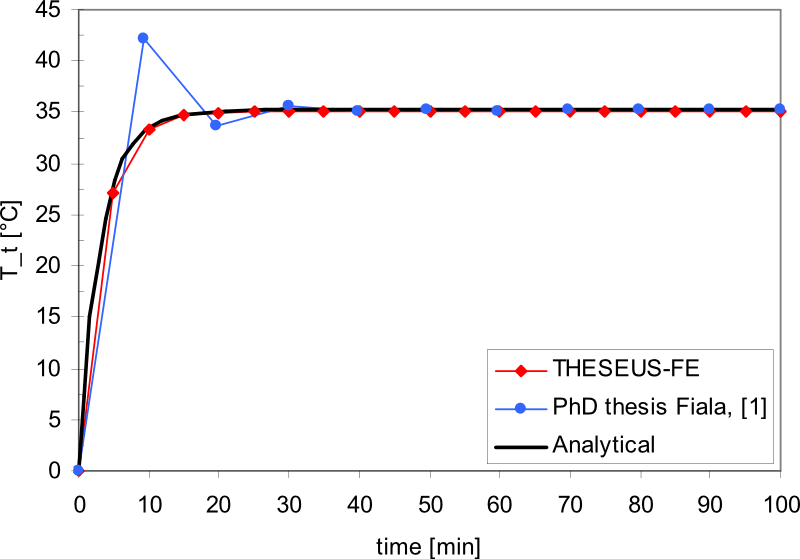
Comparison of predicted muscle tissue temperature in a leg-cylinder with exact analytically derived values following the instantaneous introduction of a high blood flow and metabolic heat. The prediction time step was 10 minutes. Results from D. FIALA's simulation had been presented originally in Fig. 3.8, [1].
Results
Dead man in a cold environment (10°C)
System and boundary conditions
| Quantity | Value | Units | Description |
|---|---|---|---|
| T init | 37 | °C | Initial temperatur of the abdomen |
| w bl | 0 | ml / cm 3 *s | Basal values for blood perfusion |
| ε w | 0.93 | Surrounding wall emissivity | |
| T a = T w | 10 | °C | Ambient temperature |
| v a | 0.1 | m / s | Environment air velocity |
| rh | 30 | % | Environment air relative humidity |
| BE | 1 | Number of body elements |
Problem description
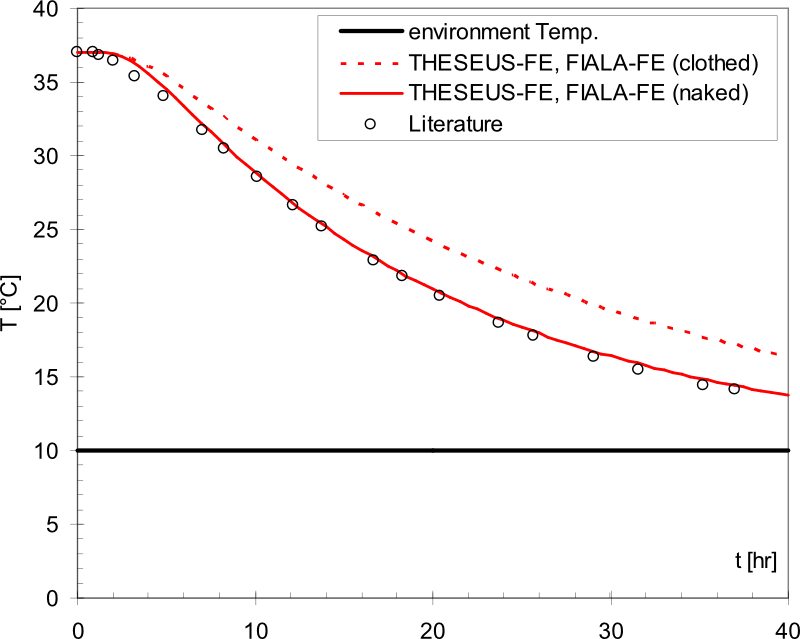
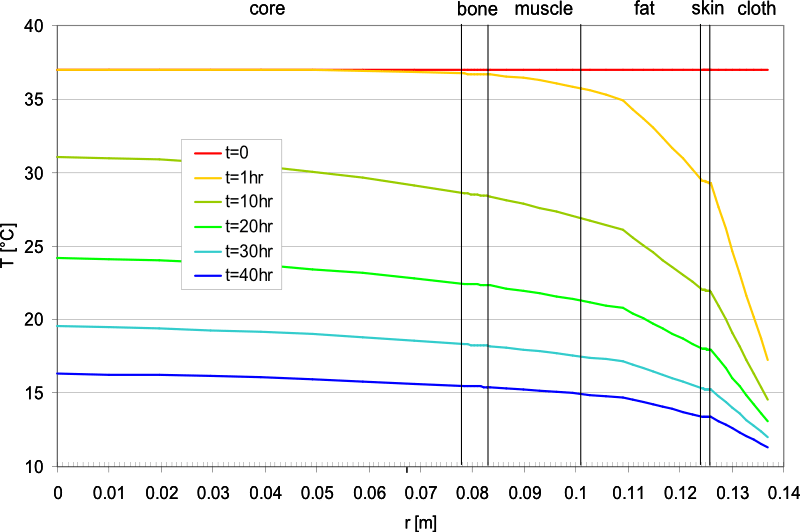
Comparison of simulated rectal temperature with results presented in literature [2], [3]. Switching metabolism and blood perfusion off inside the dead man, heat transport takes place only via conduction in the human abdomen.
Results
Naked Manikin
System
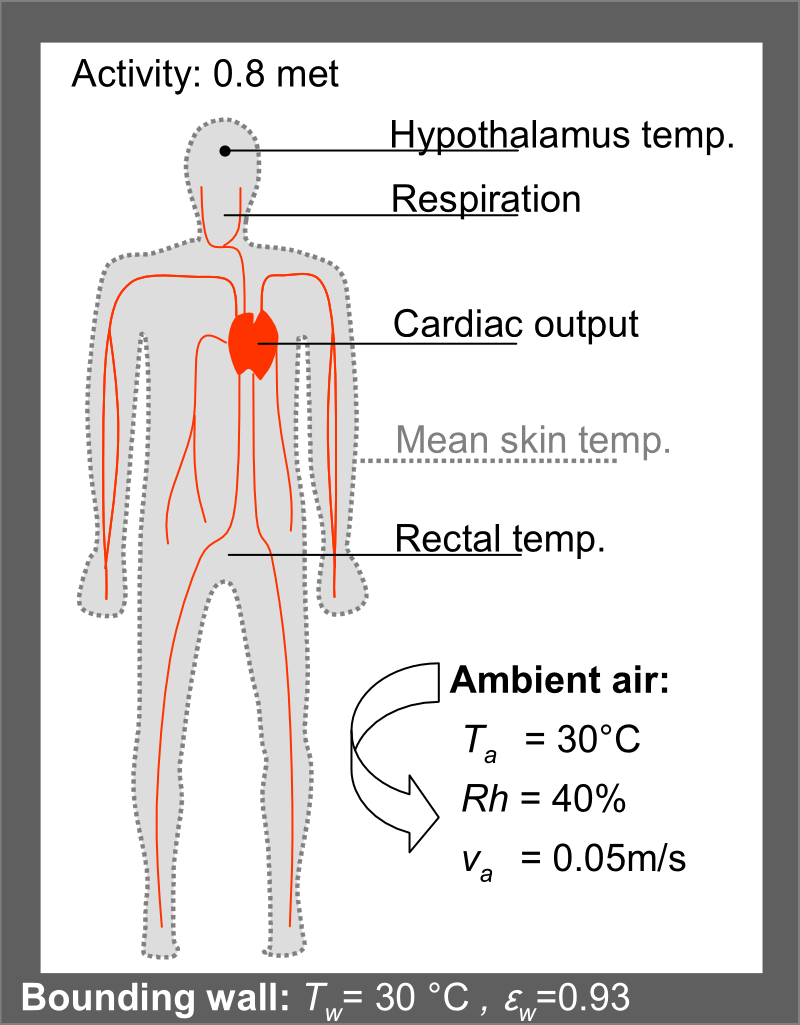
System and boundary conditions
| Quantity | Value | Units | Description |
|---|---|---|---|
| act | 0.8 | met | Activity |
| ε w | 0.93 | Surrounding wall emissivity | |
| T a = T w | 30 | °C | Ambient temperature |
| v a | 0.05 | m / s | Environment air velocity |
| rh | 40 | % | Environment air relative humidity |
| BE | 10 | Number of body elements |
Results
| Quantity | Value | Value | Units | Description |
|---|---|---|---|---|
| Wght | 73.50 | 73.53 | kg | Body weight |
| Body Fat | 14.00 | 14.44 | % | Fat/body-mass ratio |
| A sk | 1.90 | 1.86 | m 2 | Skin surface area |
| CardOut | 4.90 | 4.89 | ltr / min | Cardiac output |
| M bas,0 | 87.10 | 87.13 | W | Basal metabolism |
| T sk,m | 34.40 | 34.42 | °C | Mean skin temperature |
| T msc,m | 36.20 | 36.02 | °C | Mean muscle temperature |
| T hy | 37.00 | 36.89 | °C | Head core (hypothalamus) temperature |
| T re | 36.88 | 36.79 | °C | Abdomen core (rectal) temperature |
| h c,m | 2.70 | 2.66 | W / m 2 *K | Mean convective heat transfer coefficient |
| h r,m | 5.00 | 4.50 | W / m 2 *K | Mean radiative heat transfer coeeficient |
| Q sk | 78.50 | 78.20 | W | Skin heat loss |
| Q sk,c | 21.50 | 21.83 | W | Heat loss by convection |
| Q sk,r | 38.90 | 36.94 | W | Heat loss by (long wave) radiation |
| Q sk,e | 18.10 | 19.43 | W | Heat loss by skin evaporation |
| Q rsp | 8.50 | 8.93 | W | Heat loss by respiration |
| Q sum | 87.00 | 87.13 | W | Sum of heat losses |
Changing environment 28-18-28°C
System
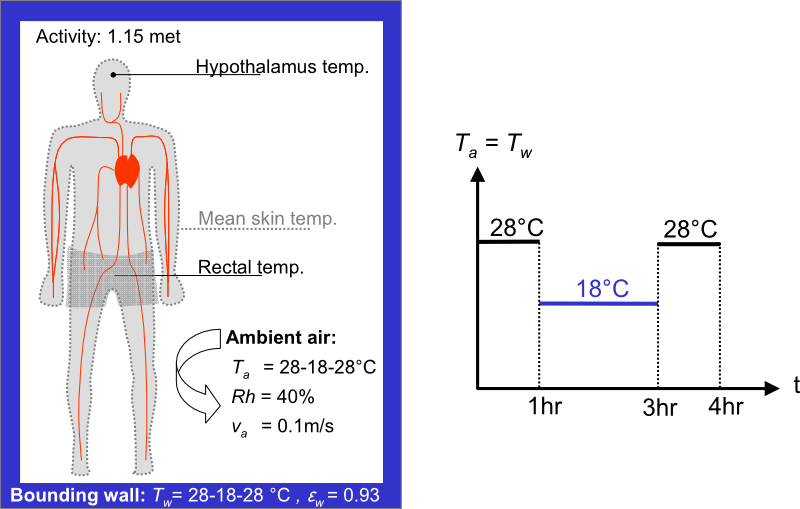
System and boundary conditions
| Quantity | Value | Units | Description |
|---|---|---|---|
| act | 1.15 | met | Activity |
| ε w | 0.93 | Surrounding wall emissivity | |
| v a | 0.1 | m / s | Environment air velocity |
| rh | 40 | % | Environment air relative humidity |
| BE | 10 | Number of body elements | |
| n | 3 | Number of test persons |
Problem description
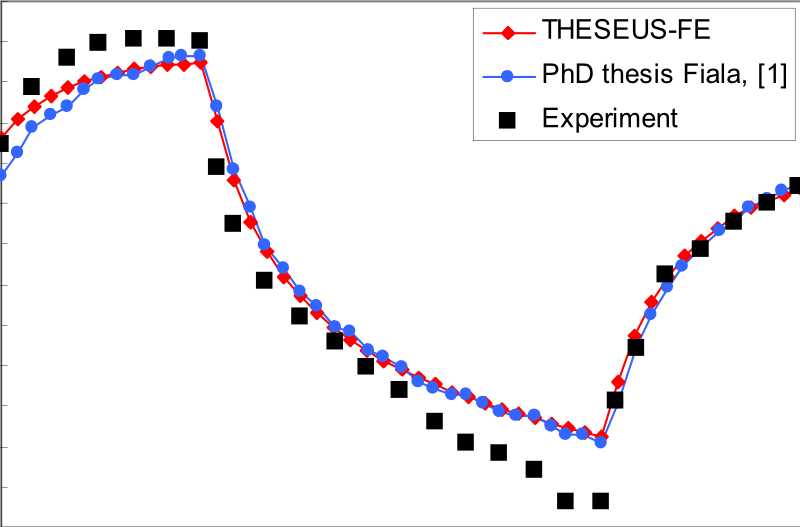
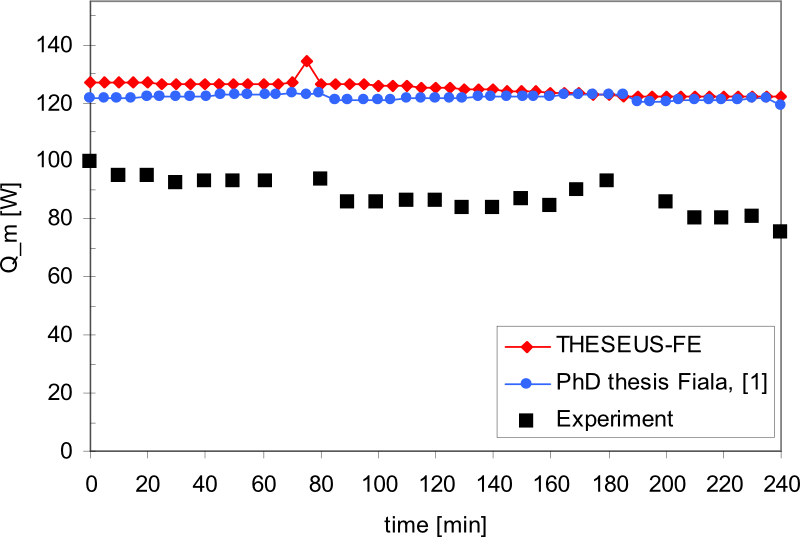
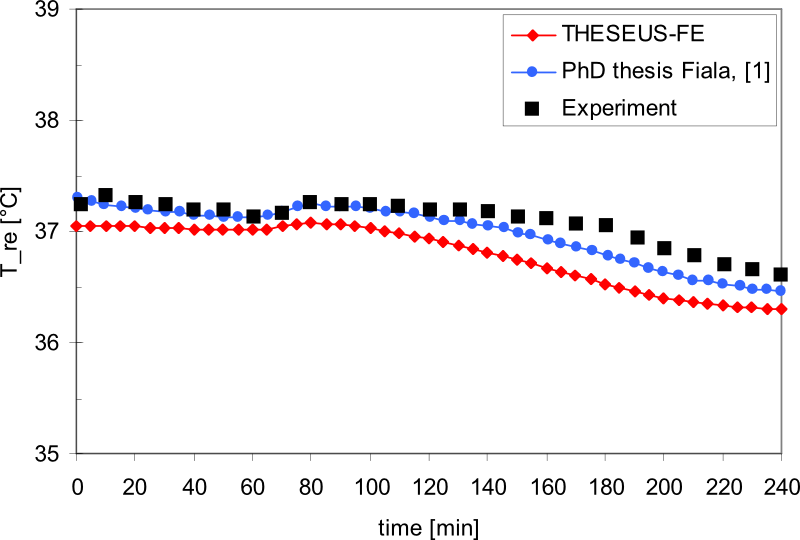
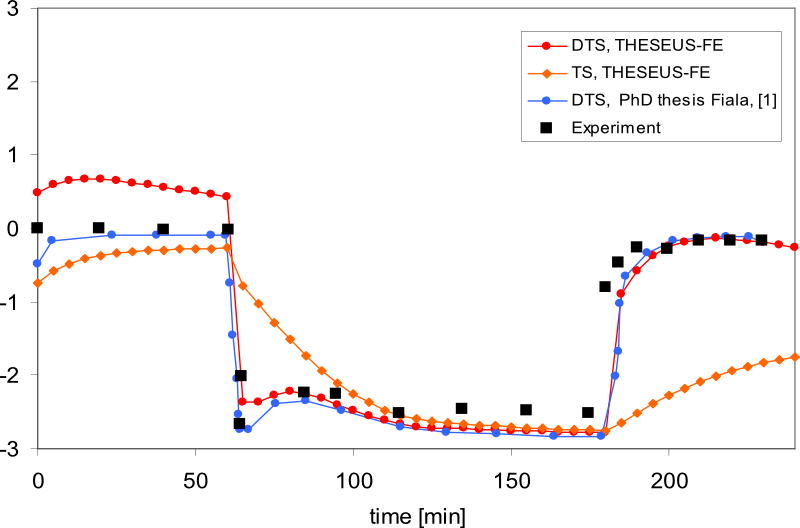
Exposure to sudden changes in ambient temperature of Ta = 28-18-28 °C investigated by HARDY et al. [4].
Simulation includes 60 min preconditioning at Ta = 22 °C and act = 2.5 met.
The preconditioning phase is not plotted in the diagrams below.
Results
Changing environment 28-48-28°C
System
System and boundary conditions
| Quantity | Value | Units | Description |
|---|---|---|---|
| act | 1.0 | met | Activity |
| ε w | 0.93 | Surrounding wall emissivity | |
| v a | 0.1 | m / s | Environment air velocity |
| BE | 10 | Number of body elements | |
| n | 3 | Number of test persons |
Problem description
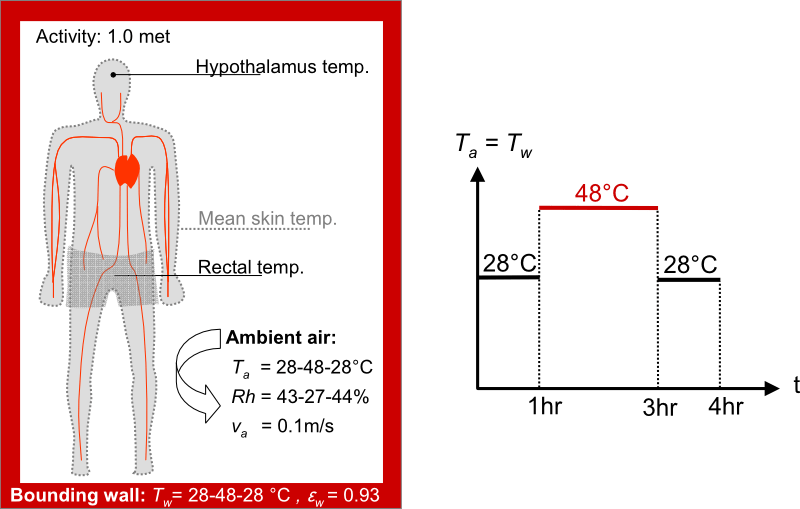
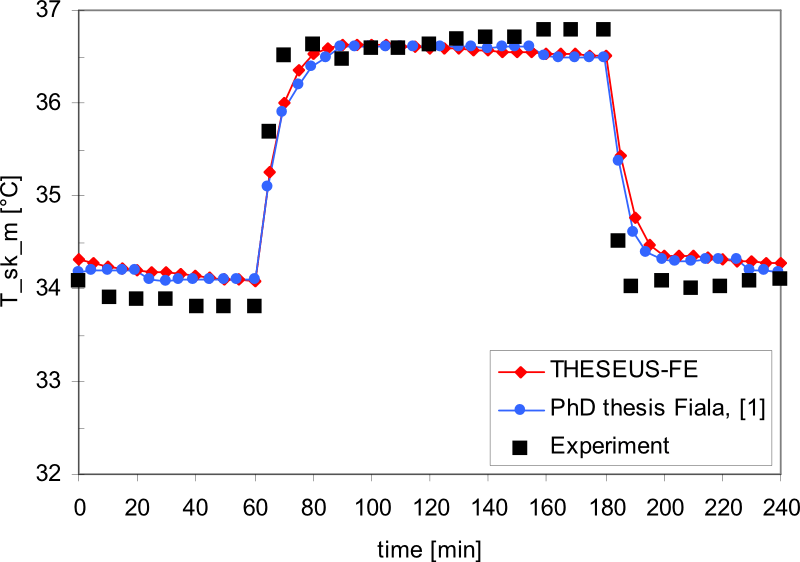
Exposure to sudden changes in ambient temperature of Ta = 28-48-28 °C investigated by STOLWIJK et al. [5].
Simulation includes 60 min preconditioning at Ta = 29 °C and act = 2.0 met.
The preconditioning phase is not plotted in the diagrams below.
Results
Cool environment at 10°C
System
System and boundary conditions
| Quantity | Value | Units | Description |
|---|---|---|---|
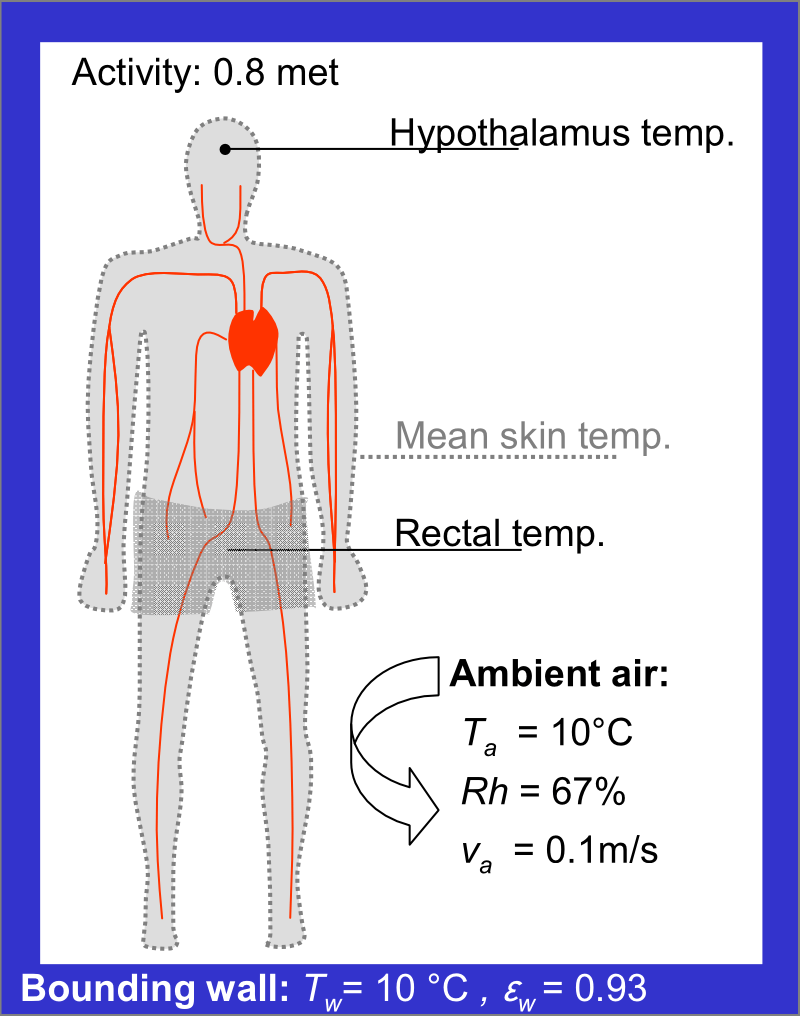
| act | 0.8 | met | Activity |
| ε w | 0.93 | Surrounding wall emissivity | |
| v a | 0.1 | m / s | Environment air velocity |
| rh | 67 | % | Environment air relative humidity |
| Icl | 0.1 | clo | Global value for Icl for the PMV calculation |
| BE | 10 | Number of body elements | |
| n | 4 | Number of test persons |
Problem description
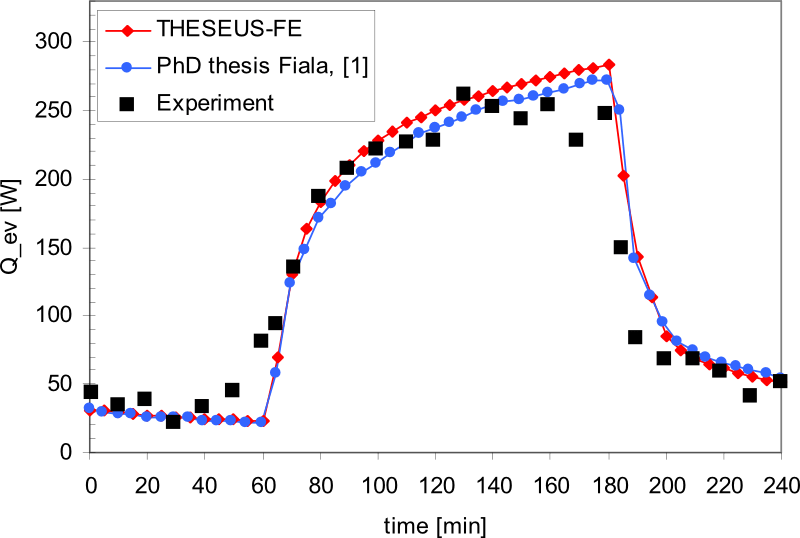
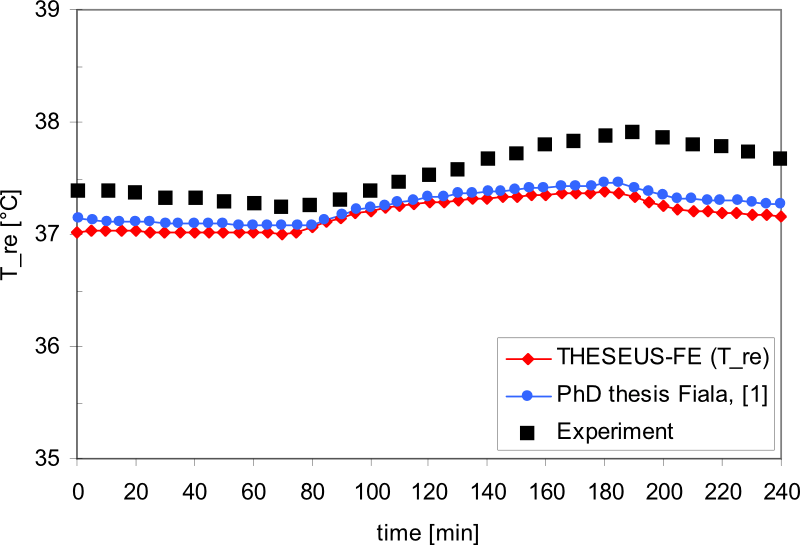
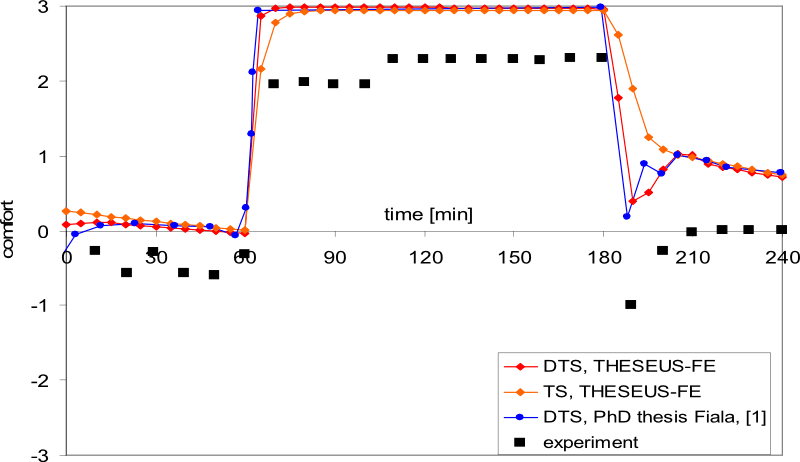
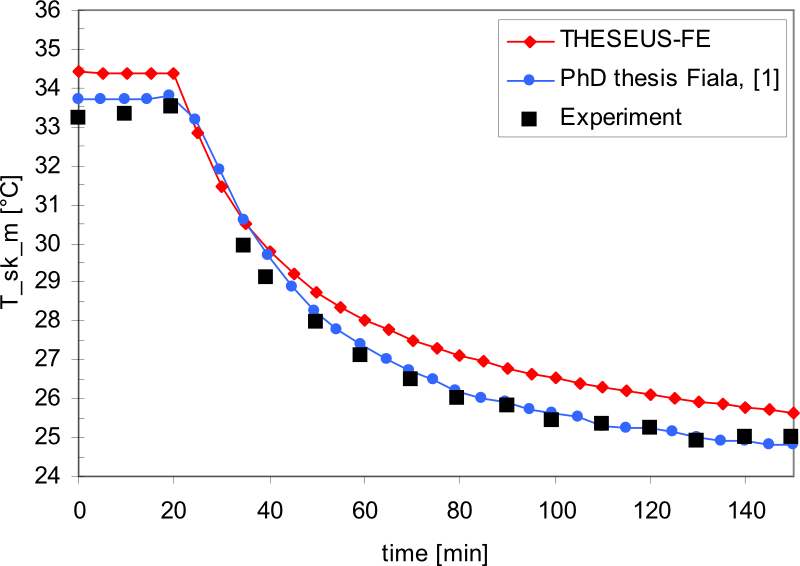
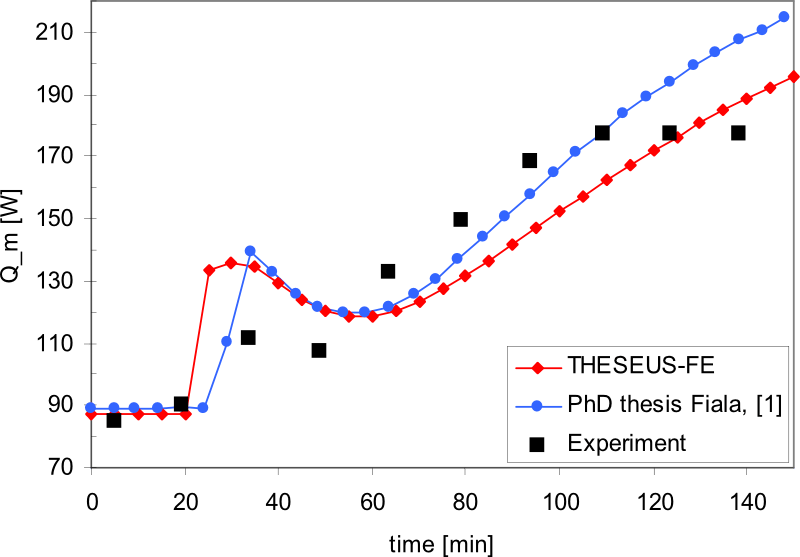
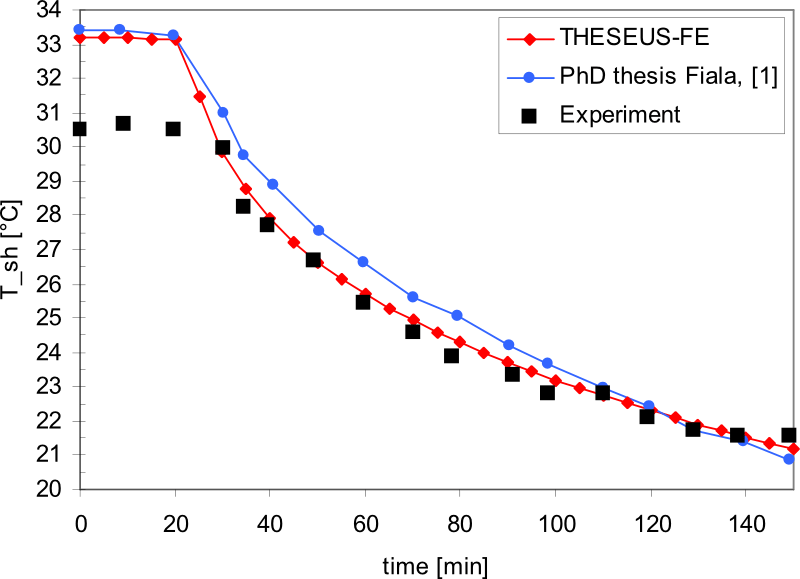
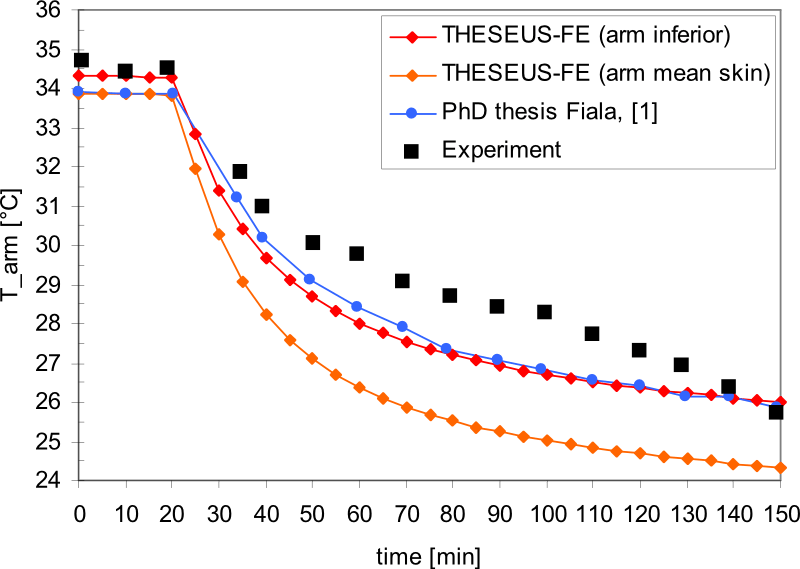
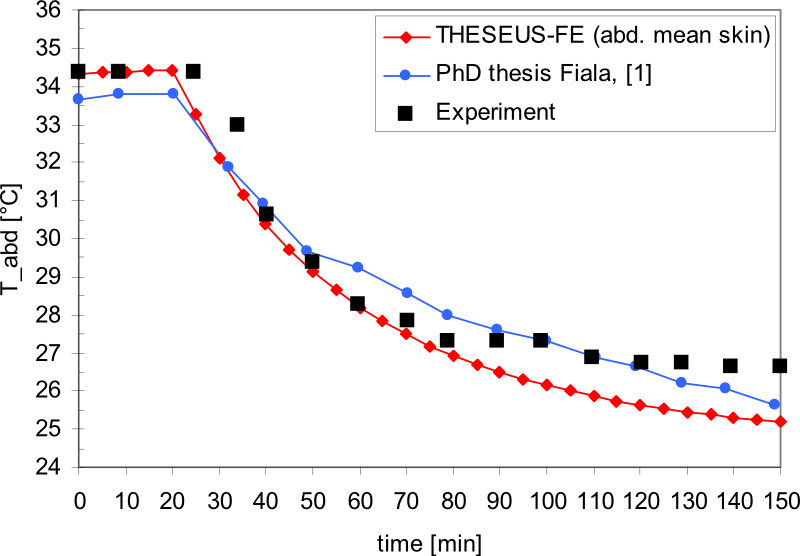
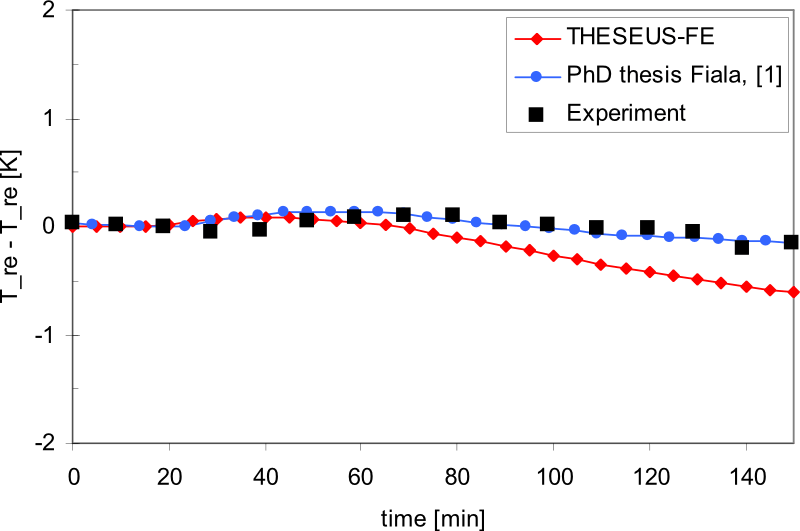
Exposure to an environment of Ta = 10 °C investigated by BUDD et al. [6].
Results
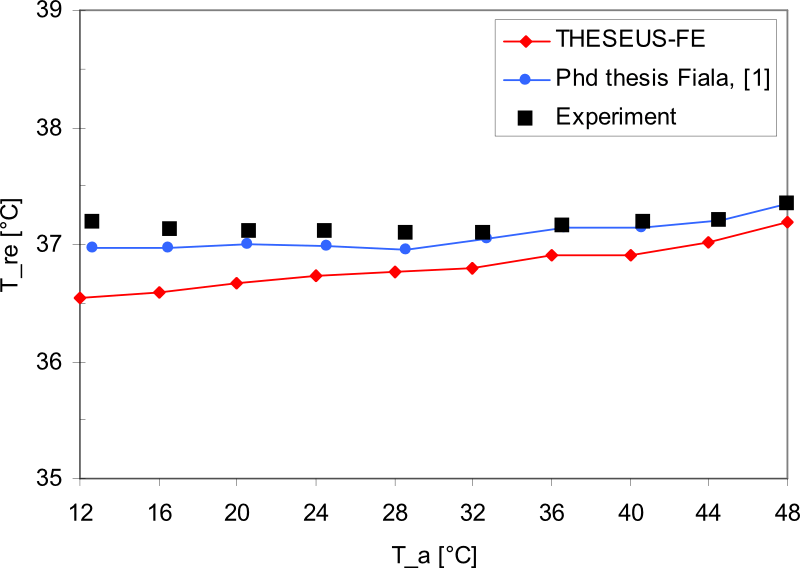
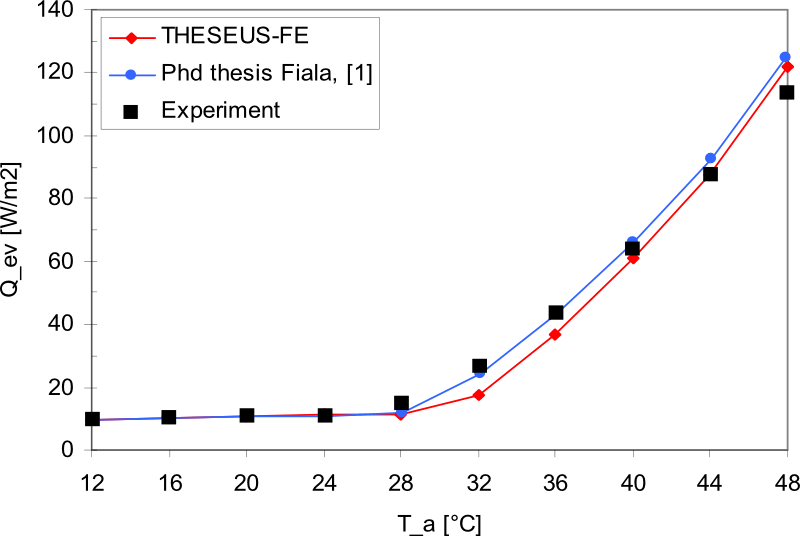
Naked manikin - 1 hour exposure - wide range of environmental conditions
System
System and boundary conditions
| Quantity | Value | Units | Description |
|---|---|---|---|
| act | 1 | met | Activity |
| ε w | 0.93 | Surrounding wall emissivity | |
| v a | 0.1 | m / s | Environment air velocity |
| rh | 30 | % | Environment air relative humidity |
| Icl | 0.1 | clo | Global value for Icl for the PMV calculation |
| BE | 10 | Number of body elements | |
| n | ≥3 | Number of test persons |
Problem description
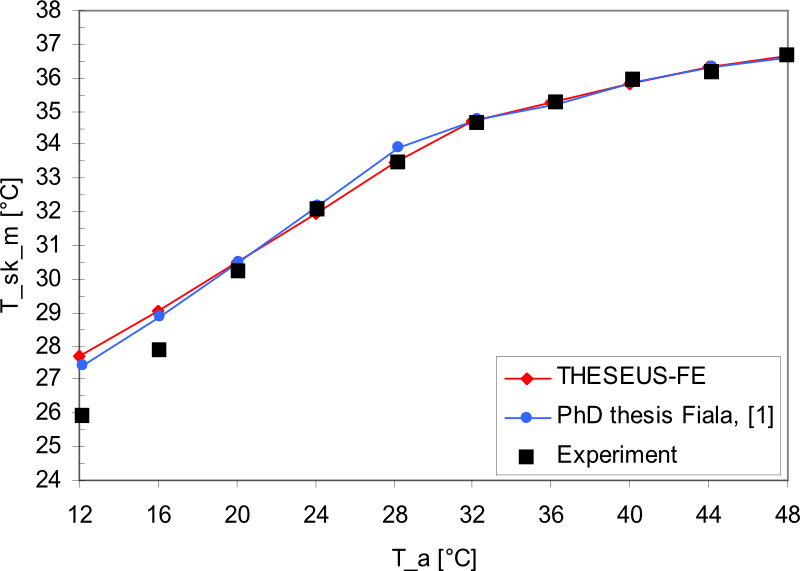
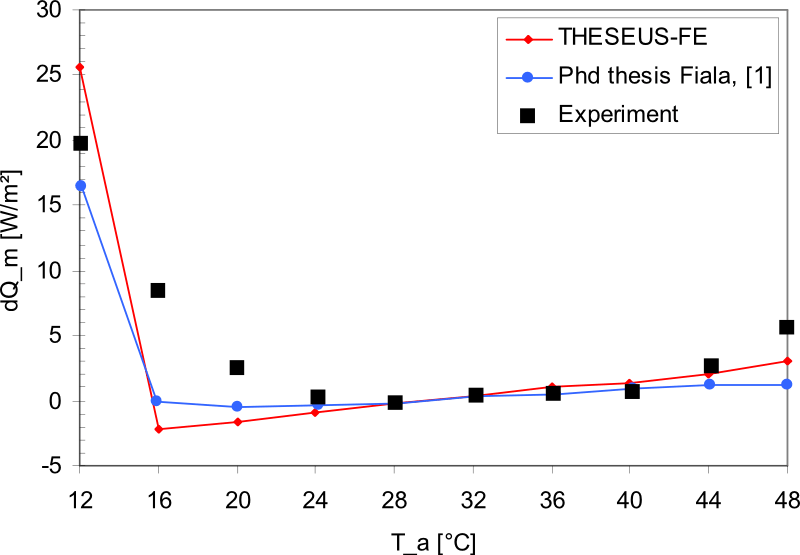
Skin temperature, body core temperature and regulatory responses as measured and as predicted by the model over a wide range of environmental conditions [7], [4]. Each data point represents a separate 1-hr exposure to the particular ambient temperature.
Results
Bibliography
| [1] | FIALA D. Dynamic simulation of human heat transfer and thermal comfort. PhD thesis. De Montfort University, Leicester. 1998 |
| [2] | HENSSGE, C., MADEA, B., Methoden zur Bestimmung der Todeszeit an Leichen, Schmidt-Römhild, Lübeck, pp 133-201, 1988. |
| [3] | ECKL, M. ,Temperaturgestützte Todeszeitschätzung bei nur partiell bekannten Umgebungsbedingungen, PhD thesis, LMU Munich, 2004. |
| [4] | HARDY J.D., and J.A.J. STOLWIJK. Partitional calorimetric studies of man during exposures to thermal transients. J. Appl. Physiol., vol. 21, pp. 1799-1806, 1966. |
| [5] | STOLWIJK J.A.J., and J.D. HARDY. Partitioned calorimetric studies of responses of man to thermal transients. J. Appl. Physiol., vol. 21, pp. 967-977, 1966. |
| [6] | BUDD, G.M., and N. WARHAFT. Body temperature, shivering, blood pressure and heart rate during a standard cold stress in Australia and Antarctica. J. Physiol. (London), vol. 186, pp. 216-232, 1966. |
| [7] | GAGGE A.P., J.A.J. STOLWIJK, and J.D. HARDY. Comfort and the thermal sensation and associated physiological responses at various ambient temperatures. Environmental Research 1, pp. 1-20, 1967. |


